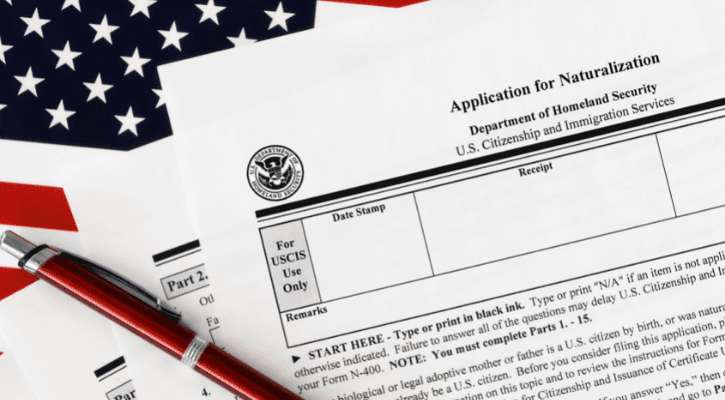
Citizenship and Naturalization Are Under Attack (The Hill)
April 16, 2025
The Trump administration is wasting no time making American citizenship harder to access and easier to deny. Just weeks into…
News and Insights
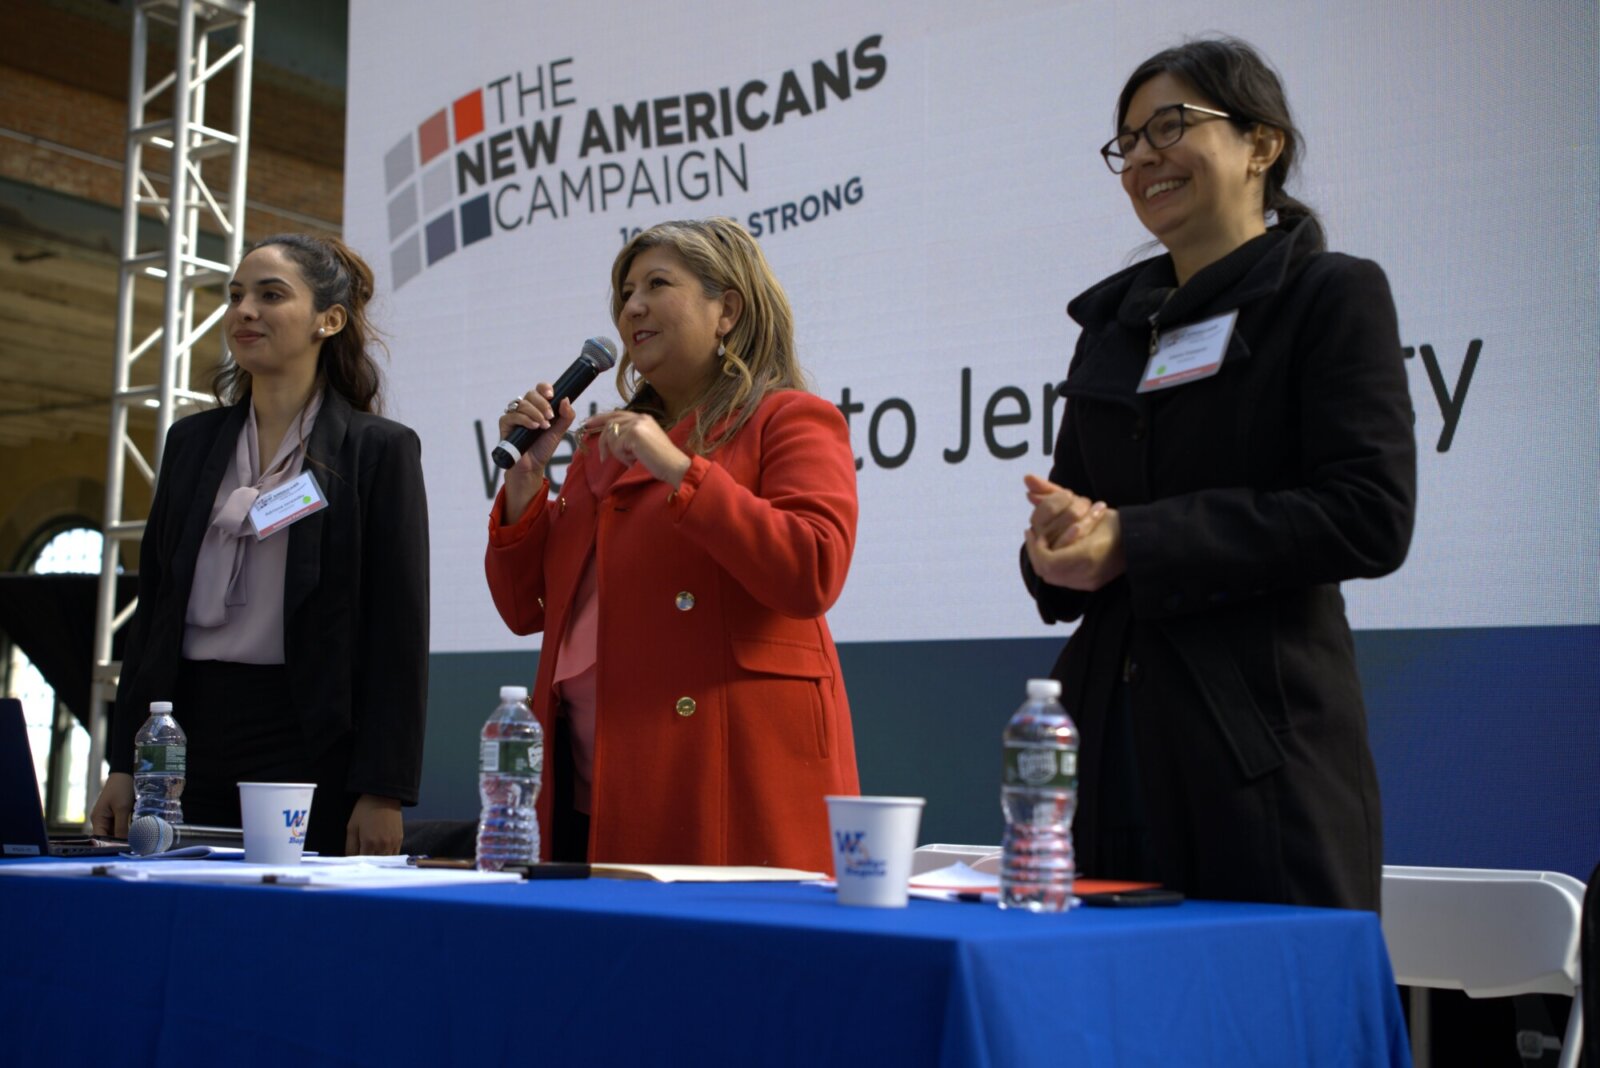
The latest from the New Americans Campaign, naturalization and citizenship news, and stories from new Americans
April 16, 2025
April 21, 2025
April 3, 2025
February 6, 2025